
- Are you attracting a large number of visitors, but struggling to see more conversions?
- Are returning buyers your main source of revenue, and you’re wondering how to acquire new customers?
- Is your competitor blowing it out of the water with that new article or whitepaper, while you’re unsure what content your business should publish?
Google Analytics data can be used to:
- Discover who your best customers are
- Get repeat sales through remarketing
- Fix bottlenecks in your conversion funnel
- Make it easier for users to buy
- Identify your most valuable pages
- Improve the shopping cart experience
- See where to allocate your marketing budget and maximize ROI
GOOGLE ANALYTICS: UNDERUTILIZED & OVERLOOKED
Companies spend thousands on market research and pricey industry reports in hopes of finding the info they need to reach their goals. But some of the best data is already available to you… and it’s free. Google Analytics offers a first-hand look into your audience trends, behavior, demographic, and more. Many businesses are overwhelmed by the sheer volume of data or simply don’t know where to start, so this valuable information goes unused. Basic analysis of seasonal patterns or seeing what pages to drive more traffic to are good practices, but aren’t really putting fuel to the fire for attaining your marketing goals. With a clarity of your Key Performance Indicators (KPIs) and knowing how to analyze this data to determine what’s working vs. what’s not, you will be able to draw actionable conclusions to take your business to the next level. Taking a more strategic approach to Google Analytics, the data can be interpreted to understand the bigger-picture and obtain insights on the business-level, like the buyer journey or market trends. This can drive the important decisions on marketing campaigns, budget allocation, and more. So, where do you start?6 Steps For Using Google Analytics to Gain Insight Into Your Business
- Define the purpose;
- Align with business goals and set marketing objectives;
- Determine KPIs and guidelines for measuring success;
- Review and analyze the data with purpose;
- Evaluate the findings
- Take action, test, and refine
1. DEFINING PURPOSE
Before establishing goals and objectives, it’s important to define the purpose of evaluating your Analytics data – what is the end result that you are trying to achieve by reviewing the data? This may seem elementary, but many professionals skip this step. Without it, it’s easy to get lost in all the data and render your trip into Analytics a huge waste of time, where all you learned was that number of sessions was up 10% (OK, but what does that mean? What actionable conclusion can you draw from that?). Define the purpose of analyzing your Analytics report and decide on a regular interval to review the data (Most local businesses can start by reviewing at a bi-weekly interval, and adjust the frequency as needed). It should look like something along the lines of:“Review Google Analytics data every 2 weeks to gain insight into our audience, gauge performance of our website, and measure success of our marketing initiatives to maximize effectiveness and efficiency, and optimize future activities to drive conversions.”It’s a mouthful, but basically, understand that it is important to keep a pulse on how your website is performing and further, use this data to measure your goals and objectives. Utilize your Google Analytics data to draw data-driven conclusions and make future decisions. No more “guesstimating.”
See the Client Success Story of how we used Google Analytics to discover new growth opportunities and drive 9x more website traffic.
Read the Case Study2. SETTING GOALS & OBJECTIVES
Before you can measure success, you have to know what success looks like to you – what are your business goals, and what are the objectives you’ve defined to track? Set SMART goals and objectives (Specific, Measurable, Attainable, Realistic, and Timely) to measure your Analytics data. Remember, goals are long-term, while objectives are the short-term ways to get there. Some examples are:Goal A: Serve as the go-to resource of information and references. Objectives:Goal B: Expand customer-base to include a greater proportion of high-value customers. Objectives:
- Increase downloads of resources by 15%.
- Increase use of our online tools by 20%.
Goal C: Grow our business by improving lead generation. Objectives:
- Increase traffic of quality prospects by 10%.
- Increase conversions of high-value products/services by 5%.
- Boost organic lead generation by 15%.
- Boost PPC / Paid Search lead by 20%.
3. MEASURING SUCCESS
Now that you know what we are working towards, how do you know if you are making any progress towards achieving these goals? Is the objective to increase traffic by 10% every period or every quarter? Determining which KPIs you will track to measure success and how often success will be measured is vital to avoid wasting time on in-actionable data. A comprehensive approach must be taken when evaluating the Google Analytics data. Viewing one or two metrics by themselves won’t be very much help. To acquire any meaning, Analytics data must be viewed outside of silos. For instance, your bounce rate alone won’t have much meaning by itself, but when you look at the metrics as a whole, you’ll get clarity as to where your opportunities lie. Establishing a baseline to compare the changes within the data will help you draw meaningful conclusions. This benchmarking is necessary to recognize trends and make this data work for you to paint the bigger picture – it’s only then that this data becomes useful for attributing success of your marketing programs. Once you have identified your goals and determined how success will be measured, you’re ready to dive into the data.4. ANALYZING THE DATA TO DRAW CONCLUSIONS
Example I. Customer Acquisition & Retention
Is your goal to acquire new customers or to retain existing ones? For the sake of this example, let’s say your focus is on customer retention.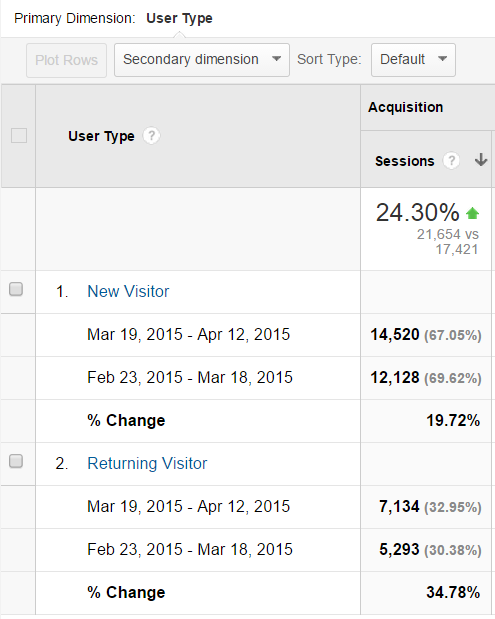
Audience > Behavior > New vs. Returning
Example II. Engaged Visits
Common metrics used to measure user engagement, such as Bounce Rate, Pages/Visit, and Avg. Visit Duration are important, but can sometimes be misleading. A much more valuable way to analyze this data is to measure the number of engaged visits. Analyzing the proportion of engaged visits will help determine if you are reaching the right audience, and if your website is improving in engaging users.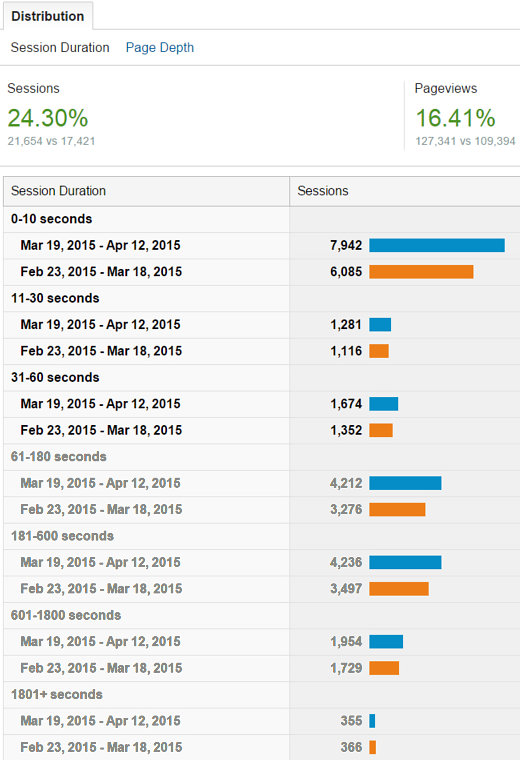
Audience > Behavior > Engagement
| Period 1: | Period 2: | |
| Total Sessions: | 17,421 | 21,654 |
| Sessions 60+ seconds (Engaged Visits): | 8,868 | 10,757 |
| Sessions less than 60 seconds: | 8,553 | 10,897 |
- In period 1, 50.90% of total sessions were engaged visits.
- In period 2, 49.68% of total sessions were engaged visits.
Example III. Content & the Buying Cycle
The number of downloads or views of your content is great, but the number alone won’t tell you anything on how to improve. By looking at the type of content being viewed or downloaded, you’re able to see where in the buying cycle your visitors are. This is information you can actually use. Someone downloading a “Widget 101 Checklist” is likely still in the initial steps of problem identification, whereas someone downloading a “Case Study: How Widget ABC Saved the Company 75%” is much later in the decision making process and, as a “hotter” lead, may be seen as more valuable / the right segment you’d like to attract. Using the data to identify how people who download this level of collateral reach your site can tell you which activities bring this segment in, vs. what’s bringing in people who are still in the very early stages of the buying cycle (and therefore may not be worth your limited time or resources to focus efforts on attracting, engaging, and converting).5. EVALUATING ACTIVITIES
The insight gained from the analysis of raw data helps determine if what you are doing is effectively reaching and engaging the right audience, and provides insight on what adjustments to make to improve performance. Keeping tabs on your Analytics data and tracking performance on a regular interval also enables you to be more agile. If there’s a negative trend, or if a new change to the website has negatively affected performance, you’ll know it within a reasonable time frame and be able to make adjustments to improve performance. Is traffic up, but people are mostly buying small-ticket or low-value items? Are your blogs or content not appealing to buyers further down the sales cycle? Is your website optimized for keywords that are associated with these low-value items? All of these answers can be found by drawing conclusions from your Google Analytics data.6. TESTING & OPTIMIZATION
Don’t be afraid to test different methods to achieve desired results. So long as you are keeping tabs on performance, don’t be afraid to test different landing pages, offers, call-to-actions, and make small tweaks to improve user experience. You never know, you may discover something that works wonderfully! Taking a more strategic approach to Google Analytics by measuring against your goals and objectives will help you determine how to optimize your digital marketing activities to maximize conversions. Having a strategic-minded marketer properly set up to measure, and analyze your website’s Google Analytics reports can take your business to a whole new level. Once a small local business, this trailer company now has national reach online that brings in over 100k website visits per month!CONCLUSION
Just like your other business and marketing ventures, your website and online marketing is an investment. Google Analytics is a tool that helps you maximize your ROI by getting insights on how to better reach your target audience, attract high-value leads that are most likely to convert, and optimize your online efforts to maximize conversions. Ready to go even further? Setting up Google Analytics Goals and Events are great next steps in making your data work for you. Implementing custom UTM parameters may also be a great option for you, as well.Free, first-hand consumer data is right at your fingertips – and better yet, it’s consumer data about your audience. Don’t miss the opportunity to utilize this data to better target, reach, and convert your audience segments. Contact our Raleigh Digital Marketing Experts at TheeDigital in Raleigh, NC at 919-341-8901 or schedule a consultation.
Tags: Digital Marketing • Search Engine Optimization • Google
Richard Horvath
Richard Horvath is the founder of TheeDigital, a Raleigh based award-winning web design and digital marketing agency. He is proud of his team and the results that they provide to their clients.