In 2025, Google Ads remains one of the most powerful advertising platforms for businesses aiming to drive targeted traffic, generate leads, and improve conversions. However, to optimize campaigns effectively, businesses need to stay informed on the latest benchmarks and performance trends.

Join our experienced team of professionals from TheeDigital as we explore the key Google Ads benchmarks for 2025, comparing them with the trends from 2024 to help businesses refine their digital marketing strategies.
Understanding 2025 Google Ads Trends
In 2025, the enhanced features of Google Ads, such as smarter automation and refined targeting capabilities, make it one of the most valuable tools for a company’s digital marketing efforts. Understanding how Google Ads operates and the latest advancements can help businesses optimize their ad spend and achieve better results.
Smarter Automation
Google Ads is embracing more automated bidding strategies and AI-driven optimizations to help businesses improve their ad performance. Automation is now at the core of Google Ads, streamlining the ad creation process and optimizing bidding strategies in real time:
- Automated Bidding: Automatically adjust bids for the most cost-effective clicks and conversions.
- Smart Campaigns: AI-driven features for easier campaign management and better targeting.
- Dynamic Search Ads: Ads that adjust automatically based on real-time search queries.
AI-Powered Targeting
Google Ads is increasingly reliant on artificial intelligence for more accurate audience targeting. AI helps advertisers reach the right customers by analyzing vast amounts of user data to predict behavior, preferences, and intent:
- Smart Audiences: Target users based on their behaviors and interests.
- Lookalike Audiences: Reach users similar to your best customers.
- Real-Time Insights: Data-driven optimizations based on user intent and behavior patterns.
Video and Visual Ads Dominance
Video and visual ads, including YouTube ads, are expected to gain more prominence in 2025. Video content is becoming increasingly important in Google Ads campaigns due to its engaging nature and higher conversion potential:
- YouTube Ads: Integrated with Google Ads for seamless targeting and retargeting across platforms.
- Responsive Display Ads: Automatically adapt your visuals to fit different placements across websites and apps.
- Engaging Video Formats: Encourage higher engagement and better conversion rates.
Enhanced Reporting Tools
Google Ads reporting is becoming more granular and intuitive, allowing businesses to track performance with greater accuracy. In 2025, you can expect more detailed metrics to better understand user behavior and campaign effectiveness:
- Cross-Device Tracking: Understand how users interact with your ads across devices.
- Actionable Insights: Use detailed metrics to refine ad performance and adjust strategies.
- Predictive Metrics: Google’s AI can predict the likely outcome of different ad strategies before they’re implemented.
Integration with Google’s Ecosystem
Google Ads now seamlessly integrates with a variety of other Google services, such as Google Analytics and Google Merchant Center, providing a unified platform for campaign management and insights:
- Google Analytics Integration: Deeper insights into traffic sources and user behavior.
- Google Merchant Center: Easier management of product ads for e-commerce businesses.
- Cross-Platform Tracking: Integrates with Google Search, YouTube, and Display Network for consistent campaign management.
Increased Focus on Local Targeting
Businesses will continue to benefit from hyper-local targeting as Google Ads focuses on delivering more relevant ads based on geographic location. With more people using mobile devices to search for nearby products and services, local targeting will play a key role in driving conversions:
- Geo-Targeting: Target users based on their specific location, including ZIP codes and radius targeting.
- Local Campaigns: Ads optimized for local businesses to drive foot traffic and conversions.
E-Commerce Integration and Shopping Ads
E-commerce businesses will continue to see increased benefits from Google Ads’ Shopping Ads and Product Listing Ads. As more businesses shift to digital storefronts, these features will become even more powerful in driving sales and conversions:
- Product Feed Integration: Streamlined integration with Google Merchant Center for product-based ads.
- Smart Shopping Campaigns: Automatically optimize bids and ad placements for maximum conversions.
- Interactive Shopping Ads: Allow users to directly purchase from ads on platforms like YouTube or Google Search.
Measuring Success with Google Ads’ Key Performance Indicators
Measuring success with Google Ads is essential for understanding how well your campaigns are performing and identifying areas for optimization. By tracking KPIs, businesses can make informed decisions to improve their ad strategies. Each of these benchmarks provides valuable insights into the effectiveness of targeting, ad creatives, and bidding strategies.
Click-Through Rate (CTR)
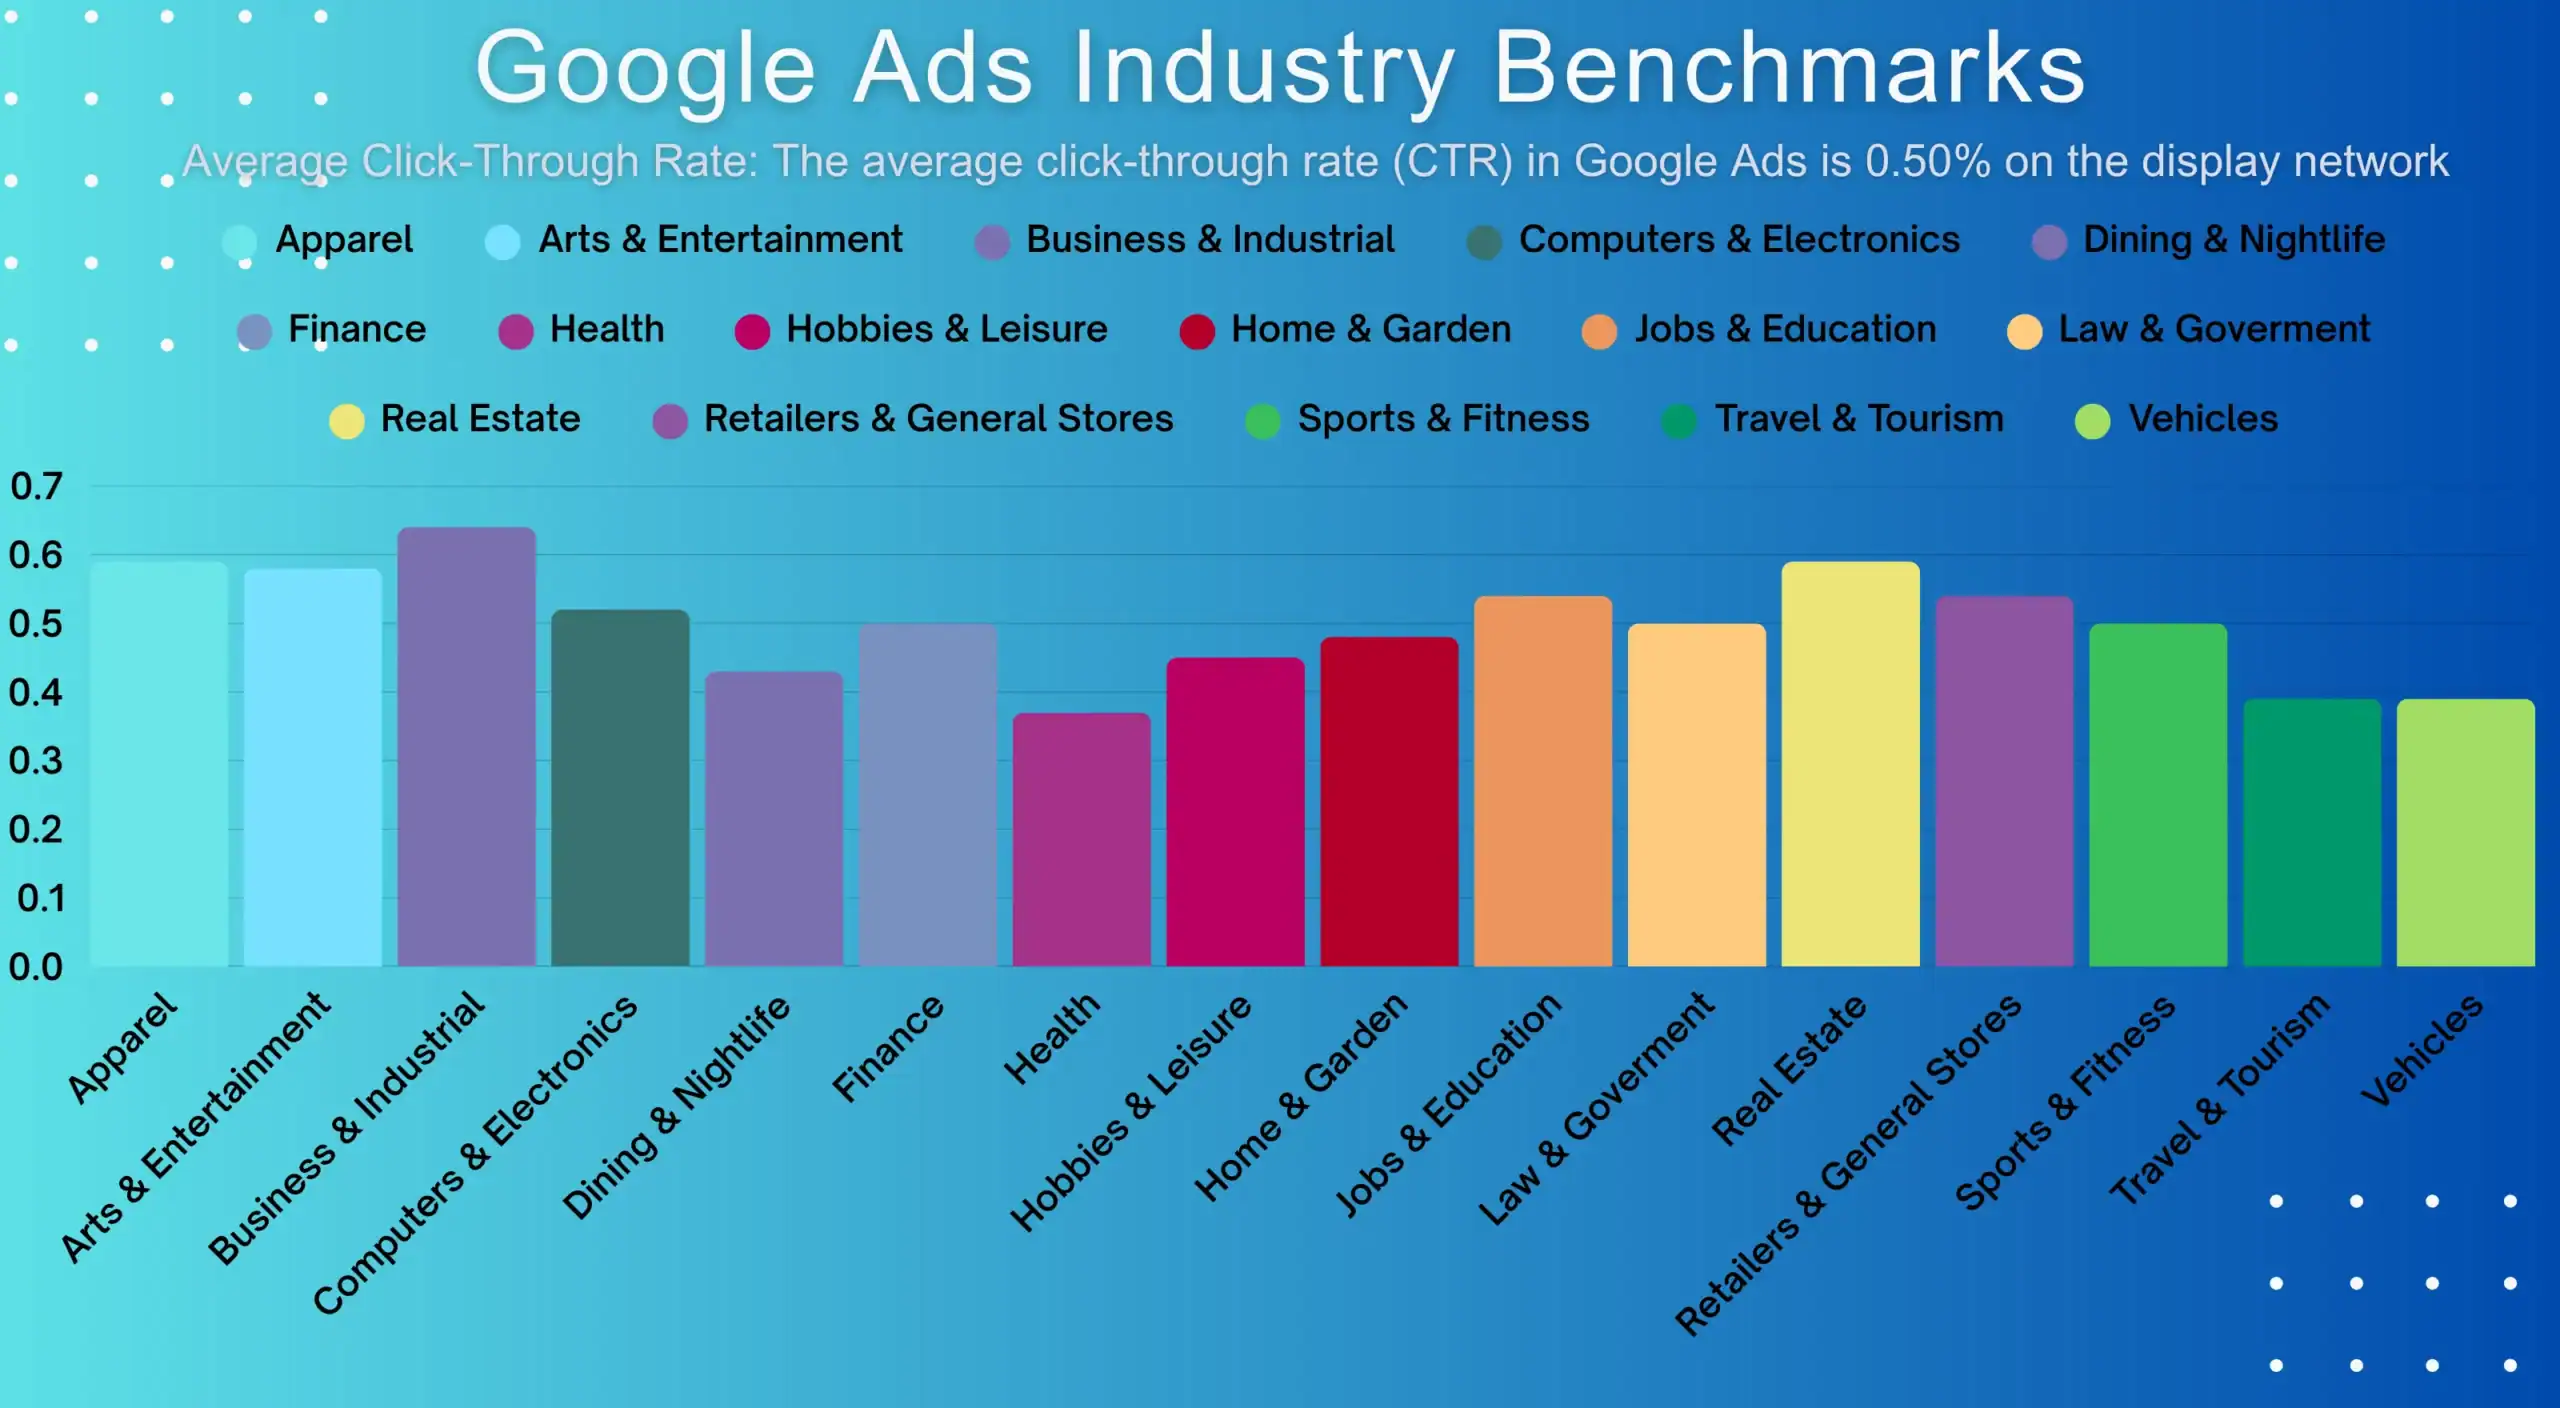
This measures the percentage of users who click on your ad after seeing it. A high CTR indicates your ad is relevant and appealing to your audience. Low CTRs may signal issues with your targeting, keyword selection, or ad copy. In 2025, the average CTR across industries is 6.66%.
Cost Per Click (CPC)
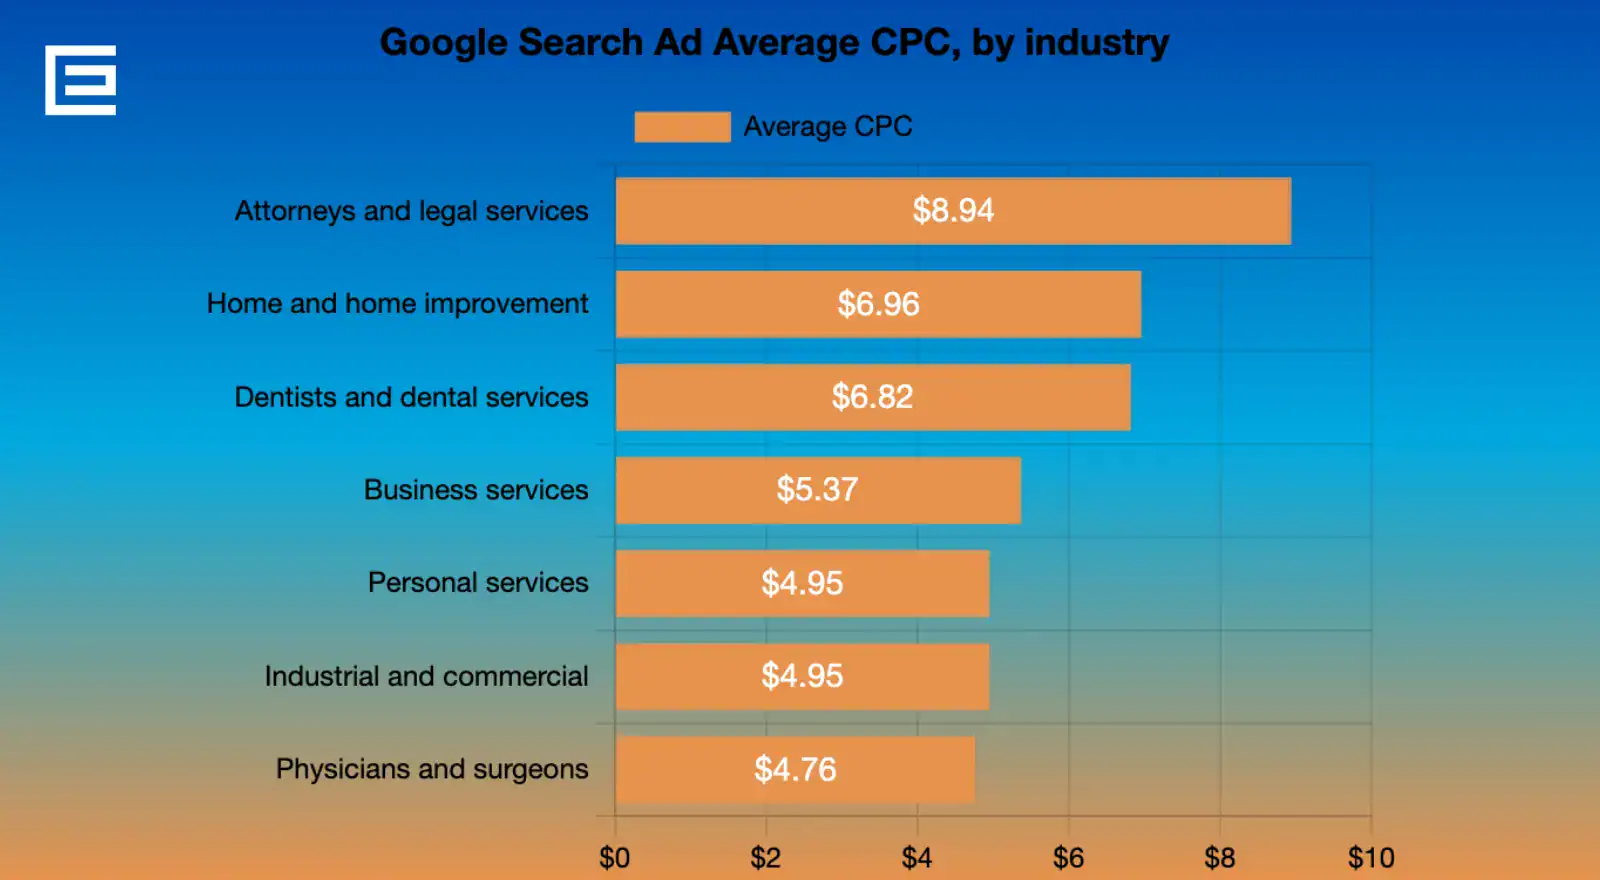
CPC refers to how much you pay for each individual click on your ad. Lower CPCs typically allow you to stretch your budget further, but it’s just as important to ensure those clicks come from qualified leads. In 2025, the average CPC across industries is $5.26, though high-competition industries like legal and education sectors may see significantly higher rates.
Cost Per Lead (CPL)
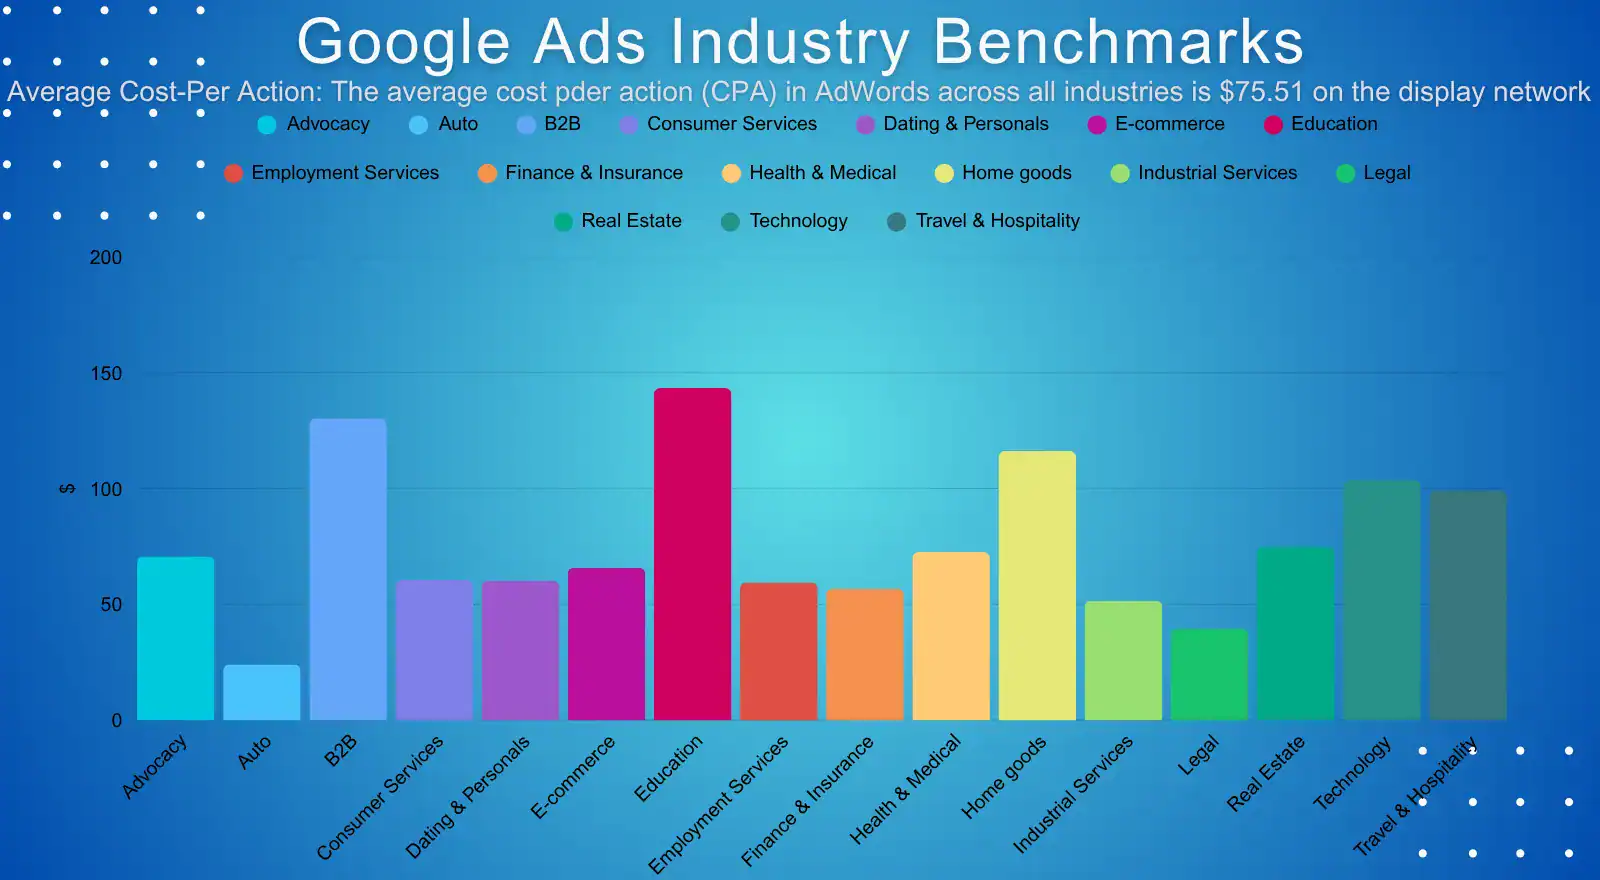
CPL measures the average amount spent to acquire one lead. It’s a vital indicator of efficiency, especially in lead generation campaigns. A lower CPL suggests your campaigns are both cost-effective and well-targeted. The 2025 average CPL is $70.11, but this varies widely by industry.
Conversion Rate (CVR)
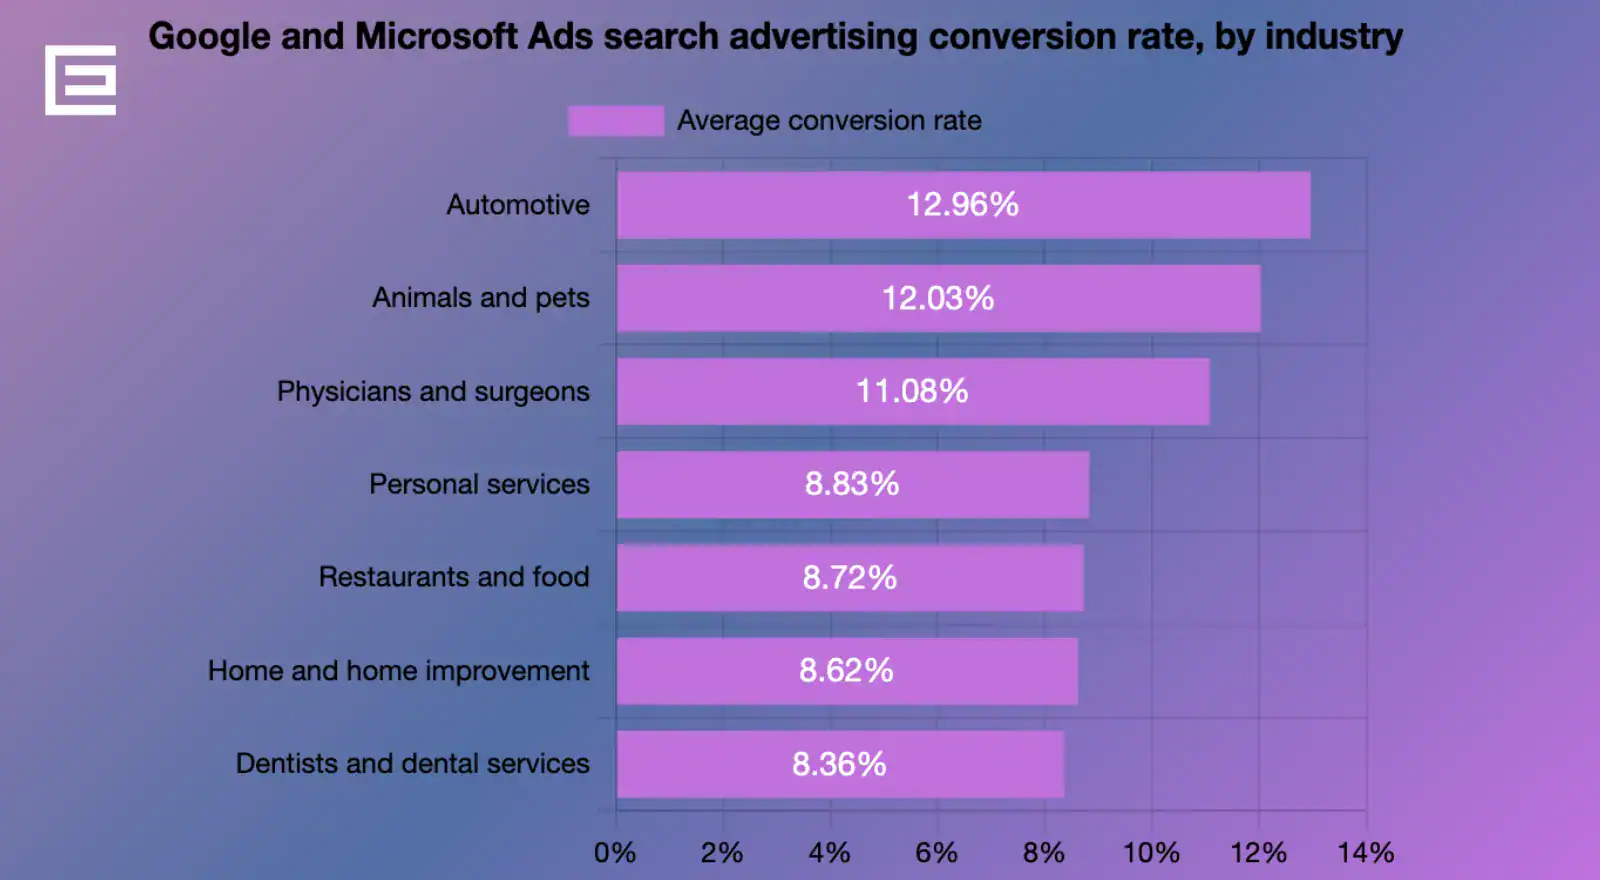
CVR tells you what percentage of ad clicks result in a desired action, such as a purchase, form submission, or contact request. High CVRs mean your ad messaging, landing pages, and user experience are successfully encouraging users to convert. The average CVR for 2025 is 7.52%, with some service industries seeing rates above 10%.
Return on Investment (ROI)
ROI calculates how much revenue your campaigns generate compared to the amount you spend. It’s the ultimate measure of profitability. A strong ROI indicates that your ads are not only driving traffic but converting that traffic into valuable business outcomes. While ROI will vary depending on your sales funnel and industry, maintaining positive ROI ensures that your Google Ads budget is driving real business growth.
2025 Google Ads Averages Across Industries
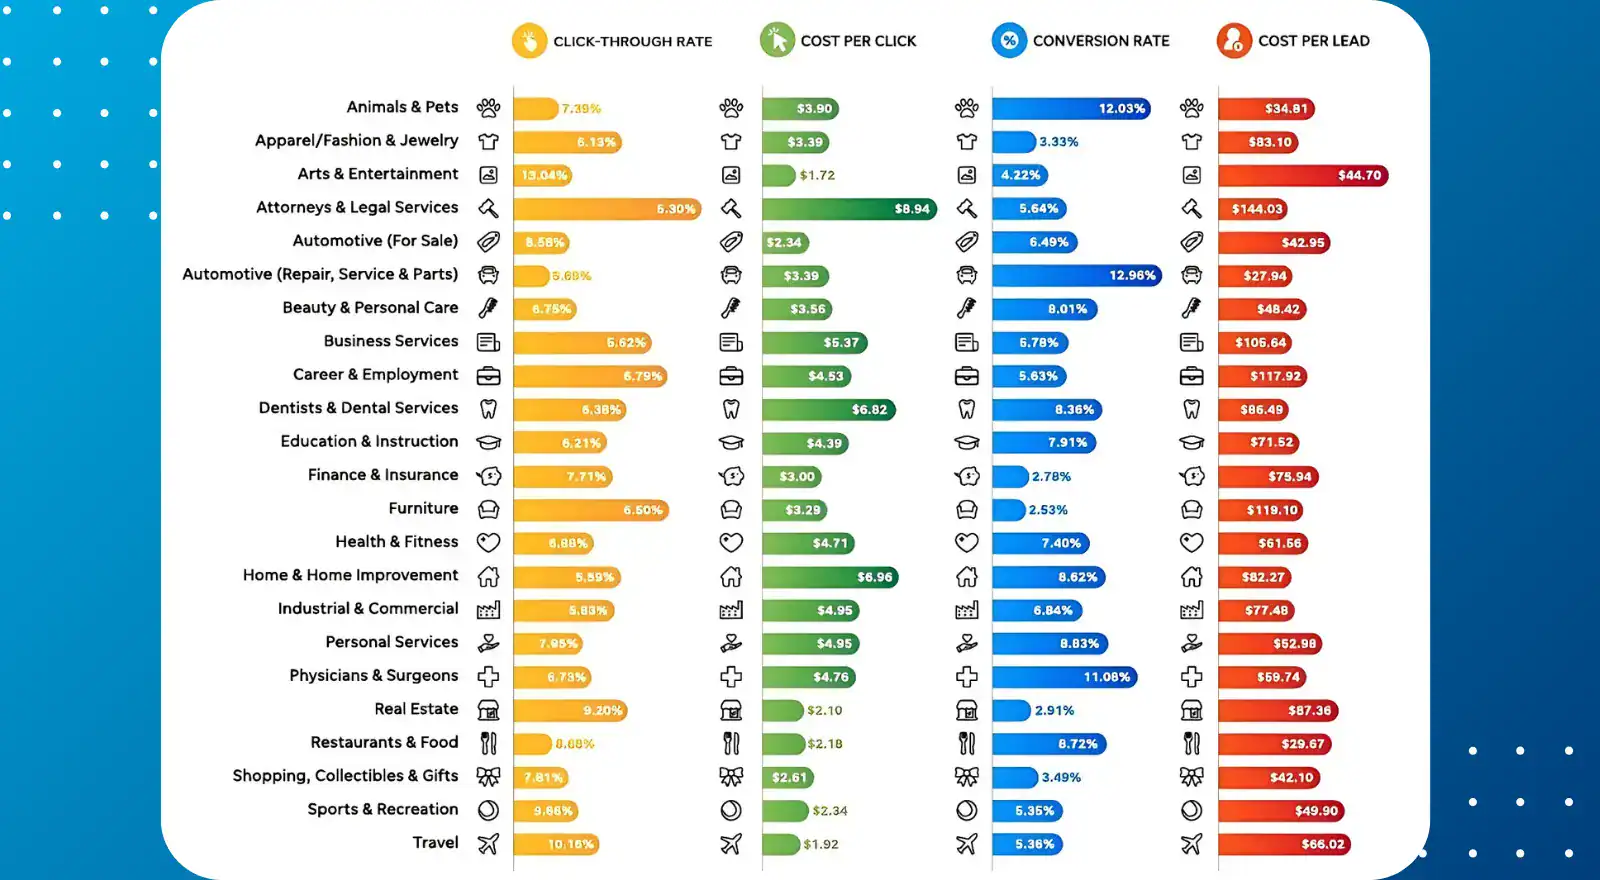
Understanding how your campaigns perform compared to overall industry benchmarks can offer valuable perspective. While each business and campaign is unique, knowing the general averages across all industries helps you assess whether you’re over- or under-performing and where to focus your optimization efforts.
Based on comprehensive data from over 16,000 campaigns across Google and Microsoft Ads, here are the 2025 average metrics for search advertising across all industries:
- Click-Through Rate (CTR): 6.66%
- Cost Per Click (CPC): $5.26
- Conversion Rate (CVR): 7.52%
- Cost Per Lead (CPL): $70.11
These figures represent aggregated performance across a wide range of sectors, from healthcare and construction to retail and entertainment. While some industries—like arts and entertainment or auto repair—see higher engagement at lower costs, others—such as legal or furniture industries—face steeper competition and higher lead acquisition costs.
If your CTR is significantly below 6.66% or your CPL is far above $70, it may be time to reevaluate your ad creative, targeting, or bidding strategy. On the other hand, performance above these benchmarks often signals that your campaigns are well-optimized for your goals.
What Do These Averages Mean for Your ROI?
While there is no one-size-fits-all ROI percentage reported across all industries, the 2025 data suggests that return on ad spend remains healthy for most advertisers. Despite a 12.88% increase in CPC, the 6.84% rise in average conversion rate helps balance out the cost increases, especially for campaigns that are well-optimized.
Ultimately, your true ROI will depend on your industry, ad quality, landing page effectiveness, and sales cycle.
2024 vs 2025 Industry Specific Google Ad Performances
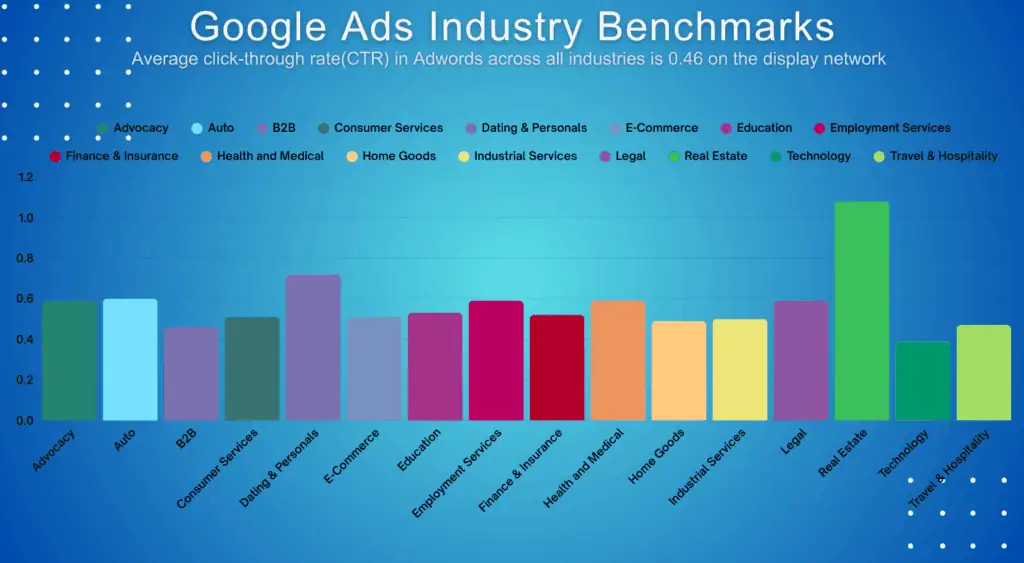
Understanding the projected changes in key metrics for a variety of business types helps business owners optimize their own ad campaigns. Let’s look at the performance benchmarks for several key industries that thrive from utilizing digital marketing strategies through Google Ads.
2024 vs 2025 Attorneys & Legal Services Benchmarks
CTR Analysis
CTR increased from 5.3% in 2024 to 5.97% in 2025. This growth reflects improved ad visibility and stronger targeting for legal service keywords. Campaigns that highlight specific legal needs—like estate planning or personal injury—continue to attract highly motivated searchers.
2024 vs 2025 CTR:
- 2024: 5.3%
- 2025: 5.97%
CPC Analysis
CPC decreased slightly from $8.95 in 2024 to $8.58 in 2025, even though legal remains one of the most competitive industries. This drop may be credited to improved quality scores and better bid optimization strategies.
2024 vs 2025 CPC:
- 2024: $8.95
- 2025: $8.58
CPL Analysis
CPL dropped from $138.20 to $131.63, indicating that law firms are achieving greater efficiency in turning traffic into leads through more targeted ad content and better conversion-focused landing pages.
2024 vs 2025 CPL:
- 2024: $138.20
- 2025: $131.63
CVR Analysis
CVR improved slightly from 4.8% to 5.09%, suggesting that law firms are not only attracting more clicks but also converting at a higher rate through clearer Call-To-Actions (CTAs) and more intuitive landing page experiences.
2024 vs 2025 CVR:
- 2024: 4.8%
- 2025: 5.09%
2024 vs 2025 Metal Building Industry Benchmarks
CTR Analysis
CTR rose from 1.2% in 2024 to 1.4% in 2025. While still below average, this increase points to enhanced ad creative and keyword strategies aimed at construction buyers and developers.
2024 vs 2025 CTR:
- 2024: 1.2%
- 2025: 1.4%
CPC Analysis
CPC declined slightly from $3.00 to $2.80, offering a more cost-efficient way for manufacturers and suppliers to gain traffic for keywords like “steel warehouse kits” and “prefab buildings.”
2024 vs 2025 CPC:
- 2024: $3.00
- 2025: $2.80
CPL Analysis
CPL decreased from $50 in 2024 to $45 in 2025, showing improved return from better-qualified leads, likely due to more detailed targeting and ad segmentation.
2024 vs 2025 CPL:
- 2024: $50
- 2025: $45
CVR Analysis
CVR increased from 3.5% to 4.0%, as landing pages and campaign messaging continue to improve in addressing user needs with clearer product details and offers.
2024 vs 2025 CVR:
- 2024: 3.5%
- 2025: 4.0%
2024 vs 2025 Construction & Home Improvement Benchmarks
CTR Analysis
CTR climbed from 6.1% to 6.37%, thanks to better use of visual creatives and localized keywords targeting remodeling, HVAC, and roofing services.
2024 vs 2025 CTR:
- 2024: 6.1%
- 2025: 6.37%
CPC Analysis
CPC increased slightly from $7.60 to $7.85, maintaining this industry’s position as one of the higher-cost sectors due to strong regional competition.
2024 vs 2025 CPC:
- 2024: $7.60
- 2025: $7.85
CPL Analysis
CPL edged up from $87.40 to $90.92, reflecting rising ad costs, though many contractors can offset this with higher-margin jobs.
2024 vs 2025 CPL:
- 2024: $87.40
- 2025: $90.92
CVR Analysis
CVR rose from 7.1% to 7.33%, driven by more refined campaign targeting and more effective lead capture on landing pages.
2024 vs 2025 CVR:
- 2024: 7.1%
- 2025: 7.33%
2024 vs 2025 Retail, Shopping, Collectibles & Gifts Benchmarks
CTR Analysis
CTR rose from 7.82% to 8.92%, one of the largest increases across all sectors. Visually rich ads and shopping formats are key contributors.
2024 vs 2025 CTR:
- 2024: 7.82%
- 2025: 8.92%
CPC Analysis
CPC climbed from $2.61 to $3.49, a 33% YoY increase, reflecting stronger e-commerce competition and the need for precise bidding strategies.
2024 vs 2025 CPC:
- 2024: $2.61
- 2025: $3.49
CPL Analysis
CPL rose from $43.45 to $47.94, but remains manageable for businesses with healthy average order values or strong seasonal performance.
2024 vs 2025 CPL:
- 2024: $43.45
- 2025: $47.94
CVR Analysis
CVR decreased slightly from 4.1% to 3.83%, suggesting the need for better checkout flows or stronger promotional offers.
2024 vs 2025 CVR:
- 2024: 4.1%
- 2025: 3.83%
2024 vs 2025 Restaurants & Food Benchmarks
CTR Analysis
CTR declined from 8.68% in 2024 to 7.58% in 2025. Despite this dip, engagement remains strong for ads promoting local takeout, delivery, and dining experiences.
2024 vs 2025 CTR:
- 2024: 8.68%
- 2025: 7.58%
CPC Analysis
CPC decreased from $2.18 to $2.05, helping local eateries keep ad costs low.
2024 vs 2025 CPC:
- 2024: $2.18
- 2025: $2.05
CPL Analysis
CPL held steady at $30.27, indicating consistent lead generation cost-effectiveness for restaurant ads tied to Google Maps and local search.
2024 vs 2025 CPL:
- 2024: $30.27
- 2025: $30.27
CVR Analysis
CVR dropped from 8.72% to 7.09%, likely tied to increased competition or mobile UX barriers.
2024 vs 2025 CVR:
- 2024: 8.72%
- 2025: 7.09%
2024 vs 2025 Health & Fitness Benchmarks
CTR Analysis
CTR rose from 6.93% to 7.18%, driven by increased interest in personal wellness and seasonal promotions.
2024 vs 2025 CTR:
- 2024: 6.93%
- 2025: 7.18%
CPC Analysis
CPC increased from $4.78 to $5.00, reflecting growing competition from fitness apps and personal training programs.
2024 vs 2025 CPC:
- 2024: $4.78
- 2025: $5.00
CPL Analysis
CPL rose slightly from $60.40 to $62.80, though many campaigns still remain cost-effective for high-retention membership services.
2024 vs 2025 CPL:
- 2024: $60.40
- 2025: $62.80
CVR Analysis
CVR improved from 6.54% to 6.80%, showing greater landing page alignment and better seasonal offer timing.
2024 vs 2025 CVR:
- 2024: 6.54%
- 2025: 6.80%
2024 vs 2025 Education & Instruction Benchmarks
CTR Analysis
CTR improved from 5.09% to 5.74%, fueled by expanded keyword targeting and informational ad formats.
2024 vs 2025 CTR:
- 2024: 5.09%
- 2025: 5.74%
CPC Analysis
CPC spiked from $4.39 to $6.23, a 41.91% increase—the largest among all industries.
2024 vs 2025 CPC:
- 2024: $4.39
- 2025: $6.23
CPL Analysis
CPL jumped from $71.52 to $90.02, underscoring the need for better conversion tracking and segmentation in education campaigns.
2024 vs 2025 CPL:
- 2024: $71.52
- 2025: $90.02
CVR Analysis
CVR soared from 7.91% to 11.38%, marking the biggest YoY gain in conversion performance, especially for certification, test prep, and online programs.
2024 vs 2025 CVR:
- 2024: 7.91%
- 2025: 11.38%
2024 vs 2025 Finance & Insurance Benchmarks
CTR Analysis
CTR grew from 7.91% to 8.33%, likely due to rising consumer interest in refinancing, personal loans, and insurance comparisons.
2024 vs 2025 CTR:
- 2024: 7.91%
- 2025: 8.33%
CPC Analysis
CPC dropped slightly from $3.68 to $3.46, helping financial service advertisers maintain strong reach at manageable costs.
2024 vs 2025 CPC:
- 2024: $3.68
- 2025: $3.46
CPL Analysis
CPL rose from $79.21 to $83.93, suggesting higher competition for qualified leads and the need for better segmentation or multi-step funnels.
2024 vs 2025 CPL:
- 2024: $79.21
- 2025: $83.93
CVR Analysis
CVR declined from 2.91% to 2.55%, one of the lowest in the dataset. This drop suggests that users are either hesitant to complete desired actions—like filling out forms or scheduling consultations—or are encountering friction in the conversion process. To reverse this trend, financial service providers should focus on strengthening trust signals, such as showcasing client reviews, security assurances, and credentials.
2024 vs 2025 CVR:
- 2024: 2.91%
- 2025: 2.55%
2024 vs. 2025: Year-Over-Year Insights
As digital advertising continues to evolve, comparing year-over-year changes in key performance metrics provides context for understanding how the search advertising landscape is shifting. In 2025, Google Ads campaigns saw both challenges and improvements, depending on the metric and industry.
2024 vs 2025 Click-Through Rate
The average CTR across industries increased by 3.74% from 2024 to 2025. While nearly half of all industries saw an increase or stabilization in CTR, the other half experienced declines. This suggests that while users are still engaging with ads, continued SERP changes and increasing competition may be impacting visibility and clickability in some sectors.
2024 vs 2025 Cost Per Click

The average CPC rose by 12.88%, with 87% of industries experiencing higher costs. This continues a multi-year trend of rising CPCs, likely fueled by increased advertiser competition and limited premium ad space. Industries like beauty and personal care and education saw CPC spikes of over 40%, making it more important than ever to optimize targeting and bidding strategies.
2024 vs 2025 Conversion Rate
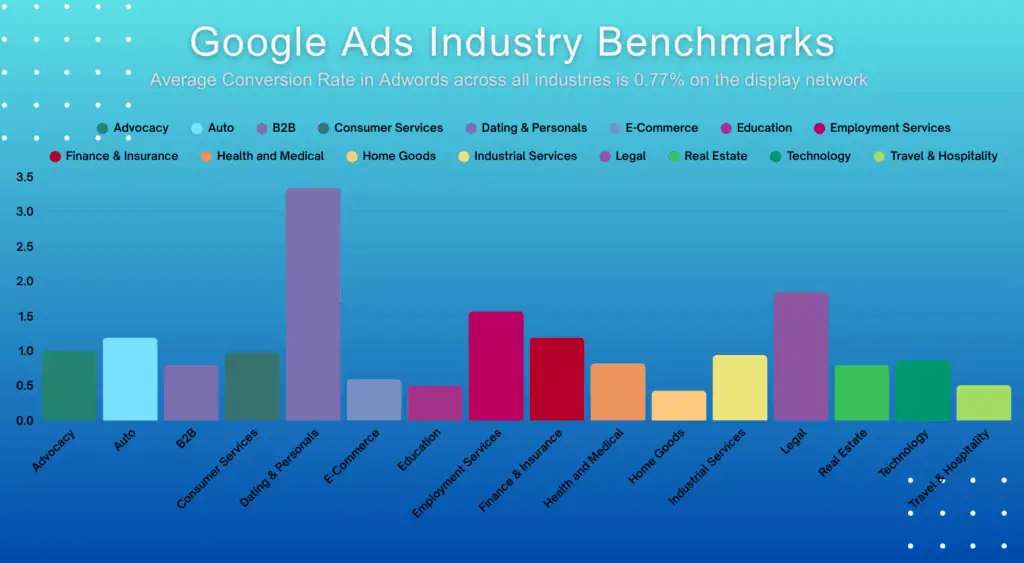
CVR improved by 6.84% across the board. Despite rising click costs, most industries (65%) saw improved conversion performance, indicating that users clicking on ads are more qualified and ready to take action. Higher CVRs also suggest that businesses are improving their landing page experiences and ad alignment.
2024 vs 2025 Cost Per Lead
The average CPL increased by 5.13%, a more modest rise compared to the 25% jump from 2023 to 2024. Thirteen out of 23 industries still saw higher CPLs, but others—such as career and employment and arts and entertainment—experienced significant decreases. This shift points to improved lead generation efficiency in some industries, despite rising CPCs.
Maximize ROI for Your Business with These Steps
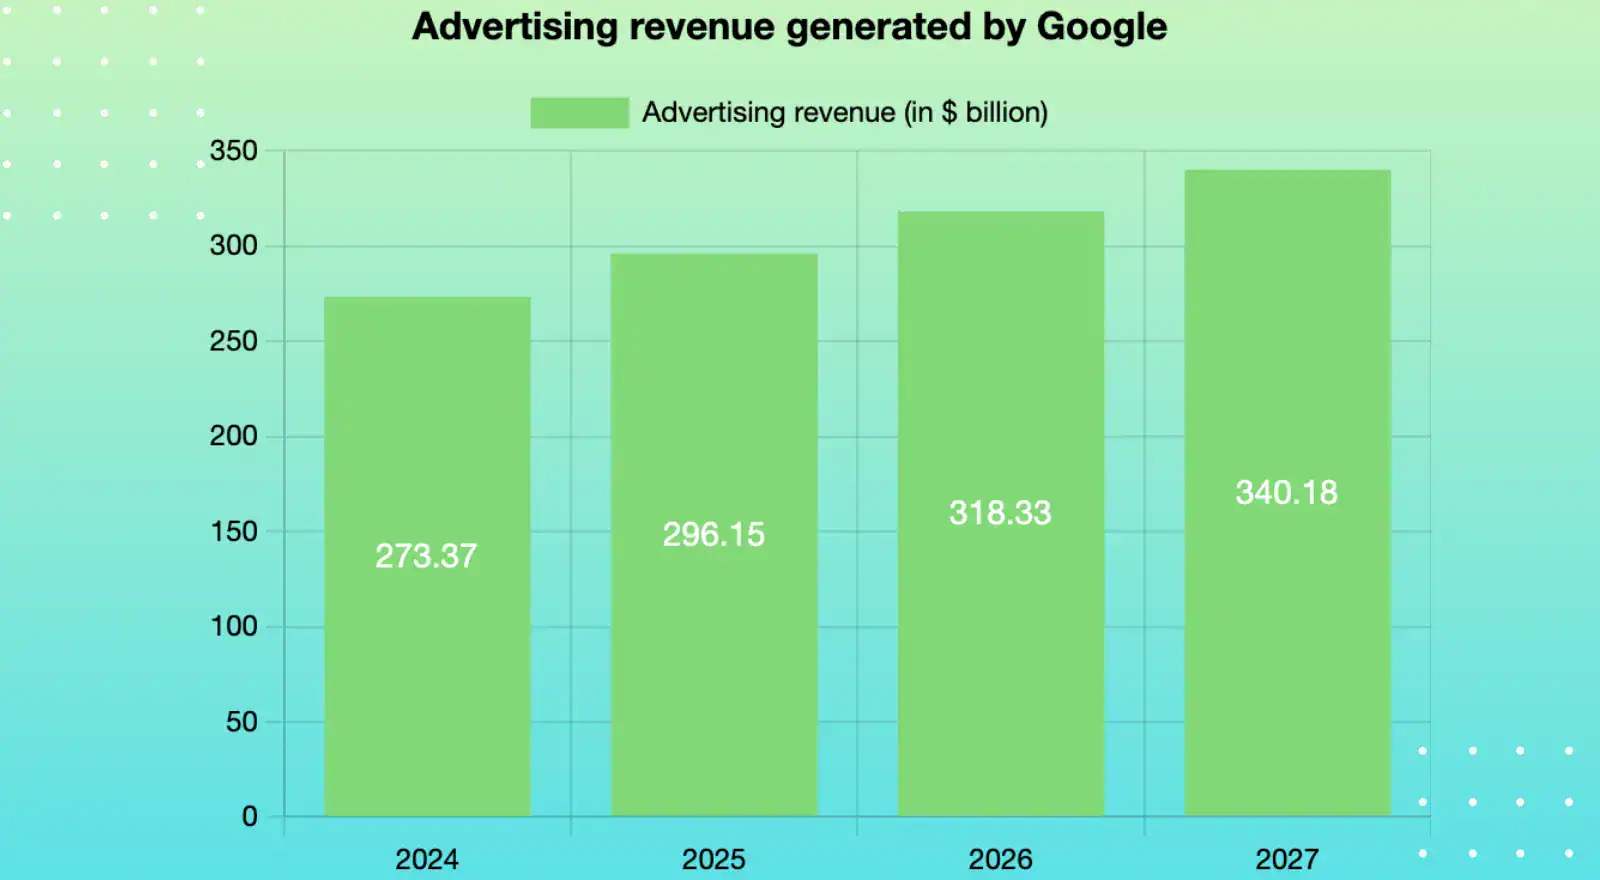
To achieve maximum ROI from your Google Ads campaigns, it’s essential to focus on strategies that drive more traffic, generate leads, and increase sales. By optimizing your targeting, creative content, bidding strategies, and landing pages, you can ensure that your ad spend delivers the best results.
Here are some actionable steps to help you get the most out of your Google Ads campaigns and boost your ROI—especially when industries like retail and shopping are seeing a CPL as low as $47.94, while others like attorneys and legal services average $131.63 per lead.
Refine Your Targeting to Reach the Right Audience
Effective targeting ensures that your ads are shown to people who are most likely to be interested in your product or service:
- Use location targeting to reach users in specific geographic areas. This is crucial for industries like construction and home services, which have a CPL of $90.92.
- Implement keyword match types (broad, phrase, exact) to control how closely a search query must match your keywords.
- Leverage audience segmentation based on demographics, interests, and past behaviors—especially in verticals like health and fitness, where a CVR of 6.80% shows targeted engagement works.
Optimize Ad Creative for Better Engagement
Your ad creative is often the first impression potential customers have of your business. By making your ads relevant, clear, and compelling, you increase the likelihood that users will click and convert:
- Create clear, action-oriented ad copy that communicates the value of your offer. Consider that the restaurant and food industry sees a strong CTR of 7.58%, suggesting effective messaging makes a big difference.
- Use eye-catching images and video ads to improve engagement.
- Incorporate callouts and sitelinks to highlight additional benefits and services—especially helpful in industries with lower conversion rates, such as finance and insurance at 2.55% CVR.
Focus on Landing Page Optimization
Your landing page is where conversions happen, so it must align with your ad’s promise. By optimizing your landing pages for both user experience and SEO, you increase the chances of turning visitors into leads or customers:
- Ensure your landing page is mobile-friendly for users on smartphones and tablets.
- Use clear CTAs that guide visitors to take the next step, whether it’s filling out a form or making a purchase.
- Improve page load speed to reduce bounce rates and keep visitors engaged. With education and instruction seeing a CVR of 11.38%, it’s clear that a seamless landing experience makes a measurable impact.
Use Smart Bidding Strategies
Google Ads offers a variety of smart bidding strategies that automatically adjust bids based on real-time data, helping you achieve your goals more effectively. Using the right bidding strategy can help you maximize your ROI by optimizing ad spend:
- Use Cost Per Acquisition (CPA) bidding to focus on generating leads at a specific cost—vital in high-CPL verticals like e-commerce with a CPL of $101.49.
- Implement Return on Ad Spend (ROAS) bidding to maximize revenue from your ads.
- Leverage enhanced Pay-Per-Click advertising to automatically adjust bids based on the likelihood of a conversion.
Track and Analyze Performance Data Regularly
Tracking key metrics like CTR, CPC, CPL, and CVR provides the data you need to make informed decisions. Regular analysis helps you identify areas for improvement and optimize your campaigns for better performance:
- Set up conversion tracking to measure actions like purchases or form submissions.
- Monitor performance reports to identify which keywords, ads, and audience segments are driving the most conversions. For example, the retail industry benefits from a low CPC of $3.49, allowing for high-volume visibility.
- Use A/B testing to experiment with different ad variations and determine which performs best.
Retarget Users to Increase Conversions
Not all users will convert the first time they see your ad, but with retargeting campaigns, you can re-engage people who have previously interacted with your website or ads. Retargeting increases the likelihood of conversion by showing your ads to users who are already familiar with your business:
- Create remarketing lists based on website visitors, cart abandoners, or past customers.
- Set up dynamic retargeting ads to show users the specific products or services they previously viewed—especially useful in e-commerce where CVR is 3.99% on average.
- Use personalized ad creatives to remind users of the value your product or service can bring to them.
Elevate Your Google Ad Campaigns with Our Marketing Experts
Take your Google Ads campaigns to the next level with our team of SEO marketing and website design experts. At TheeDigital, we help businesses nationwide refine their ad targeting, optimize ad creatives, and maximize ROI. Whether you’re aiming to drive more traffic, generate quality leads, or increase sales, we have the expertise to deliver results.
Contact us today to start optimizing your Google Ads strategy by calling 919-341-8901 or filling out our convenient online contact form to schedule your FREE 30 minute consultation.
Tags: Google • Paid Search Marketing
